Quickly add Realtime User Monitoring with Amazon CloudWatch RUM

Monitoring your application can be just as important is building it. A common pattern I will see when working with companies is all the focus has been put into building the application, with very little focus on operating it. With Amazon CloudWatch Realtime User Monitoring, we can quickly see how your web application is performing from the end-user’s perspective.
Amazon CloudWatch Realtime User Monitoring (RUM) allows you to analyse and review user behaviour, client-side errors, and page load times. This allows you to not just debug client-side issues but also monitor and alarm on issues impacting your users.
A quick visual look at CloudWatch RUM
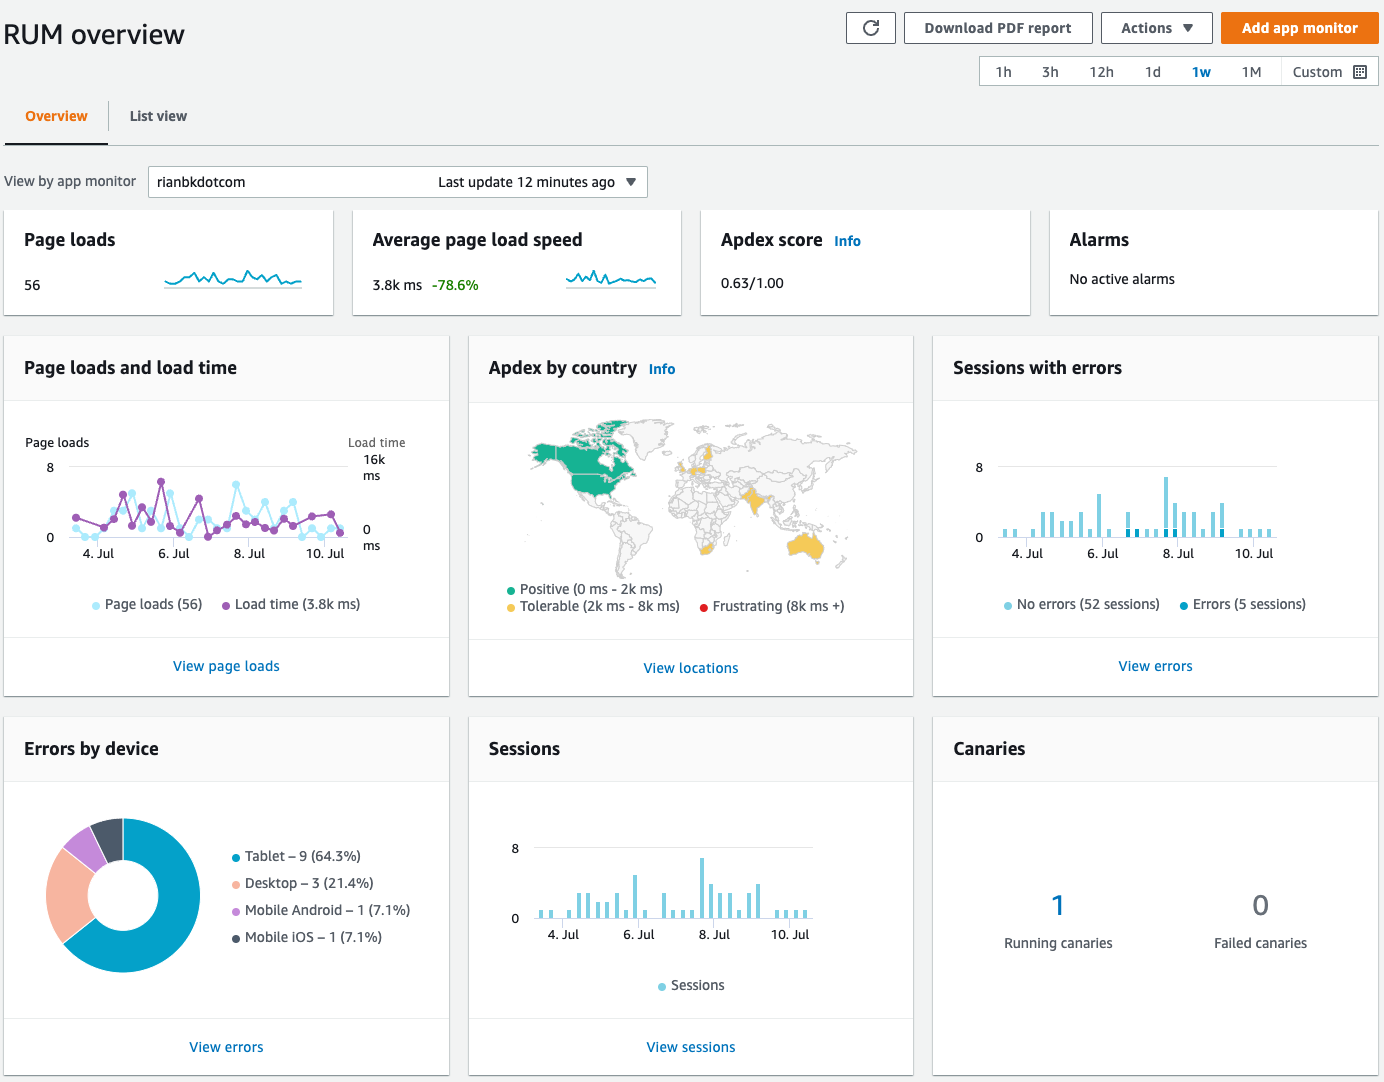
Here is the overview dashboard, this provides you a quick visualisation of what’s going on with your web application’s performance. Each section can be clicked on to drill down into more granular information.
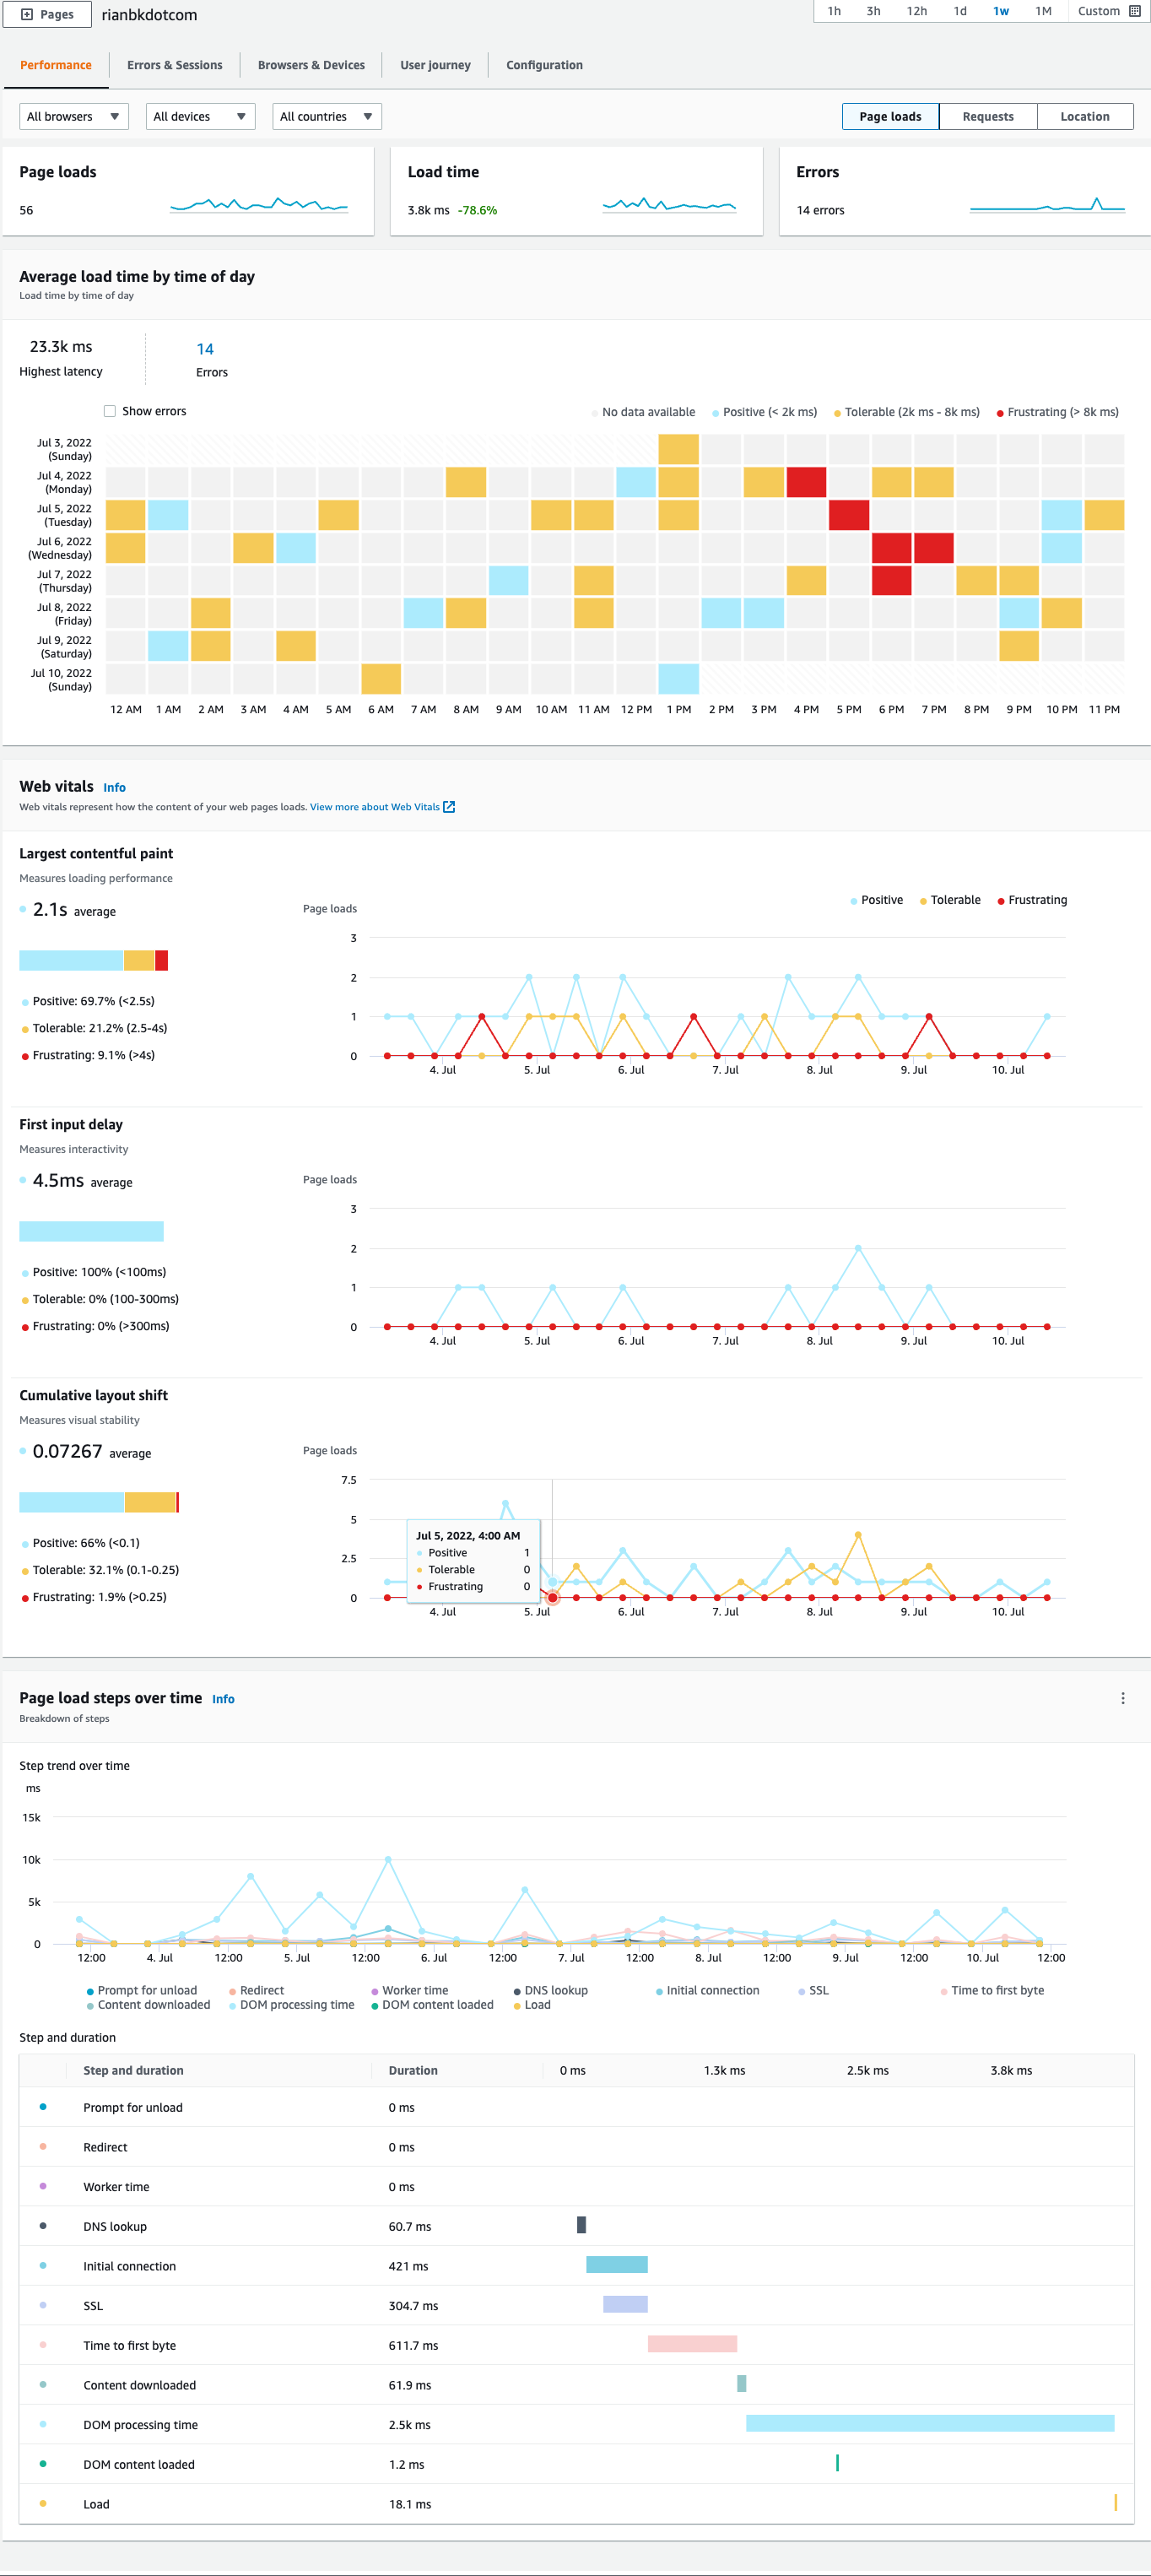
In the performance section we can see page load times, how content loads on the pages and the breakdown of page load steps over time. In the Request tab (not shown) you can see your resource requests over time and your most popular resources, and in the Location (not shown) tab you can see where all of your traffic is coming from.
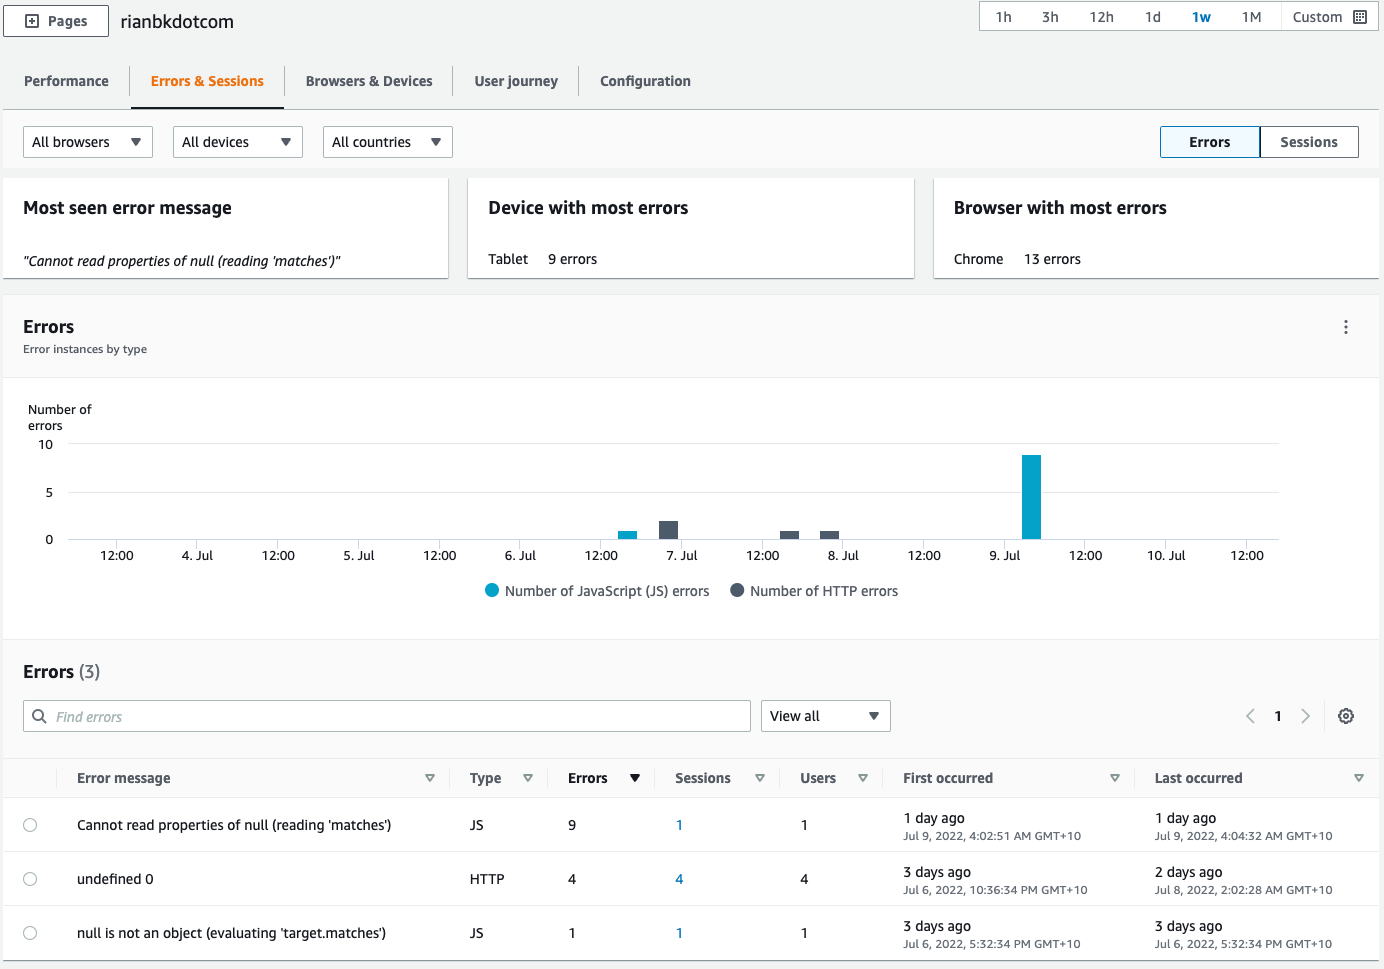
Errors & Sessions lets you see what client-side errors users are experiencing, when you drill down into the error you can get a stack trace to help debug the issue.
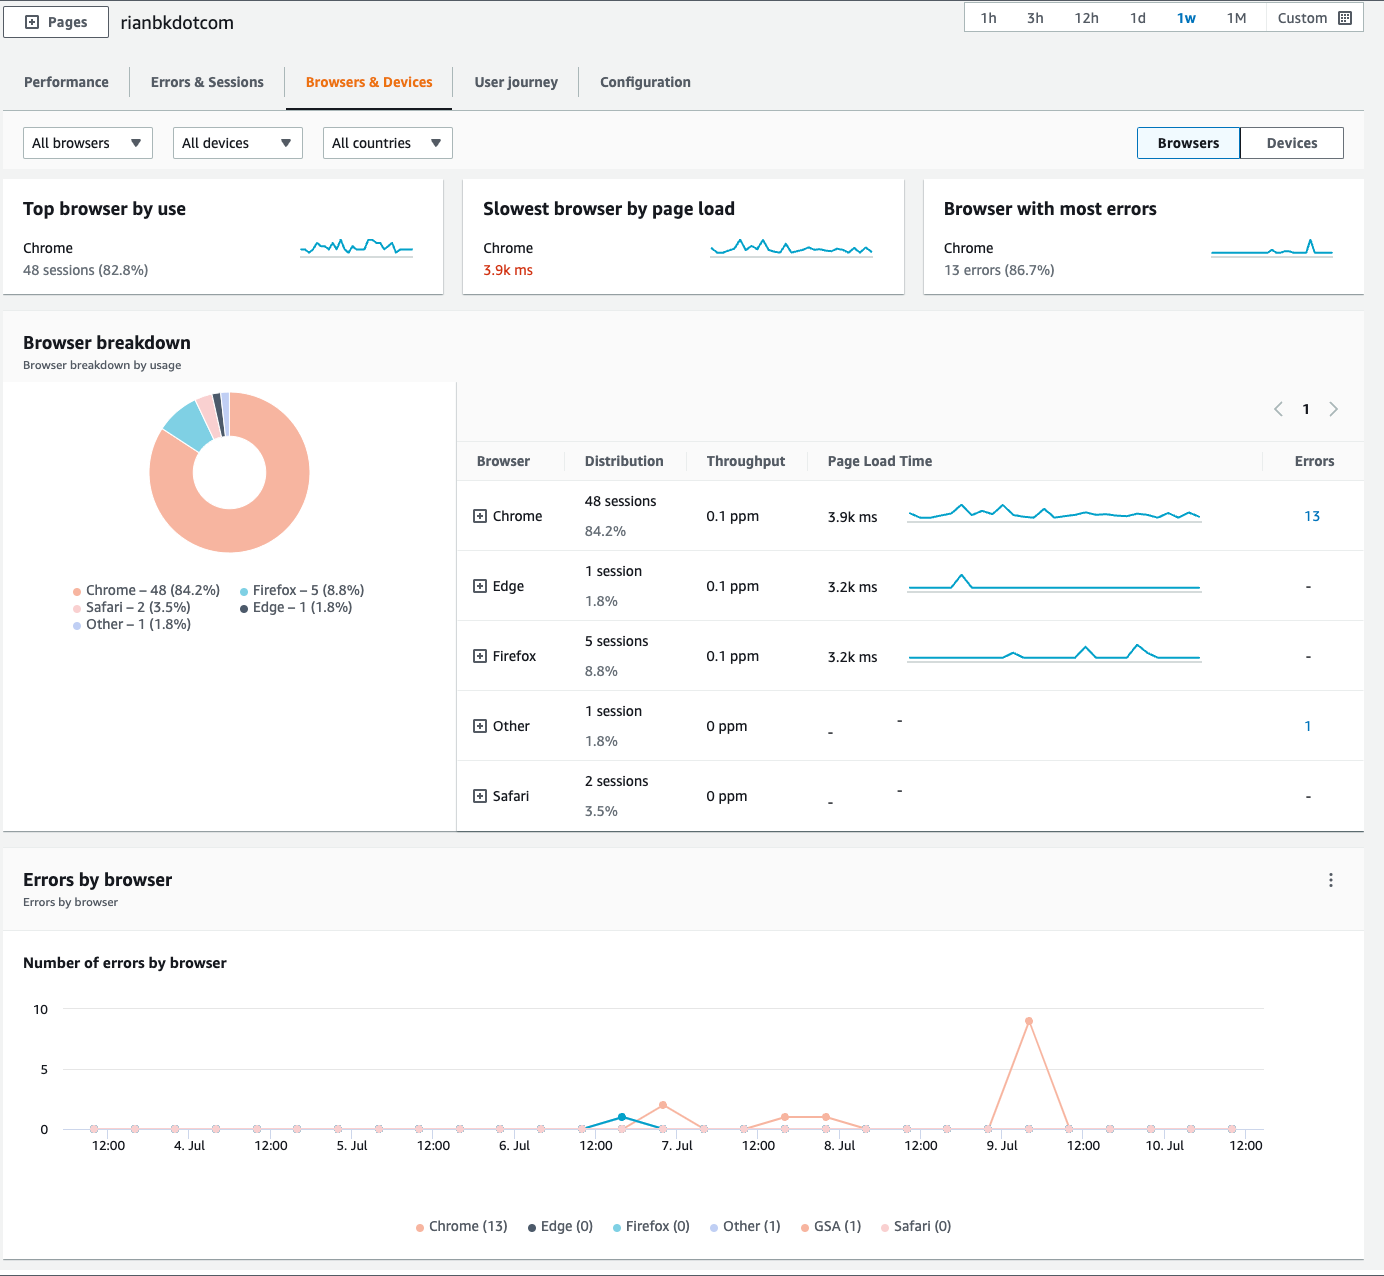
Browsers & Devices lets you get a breakdown on how people are accessing your application.
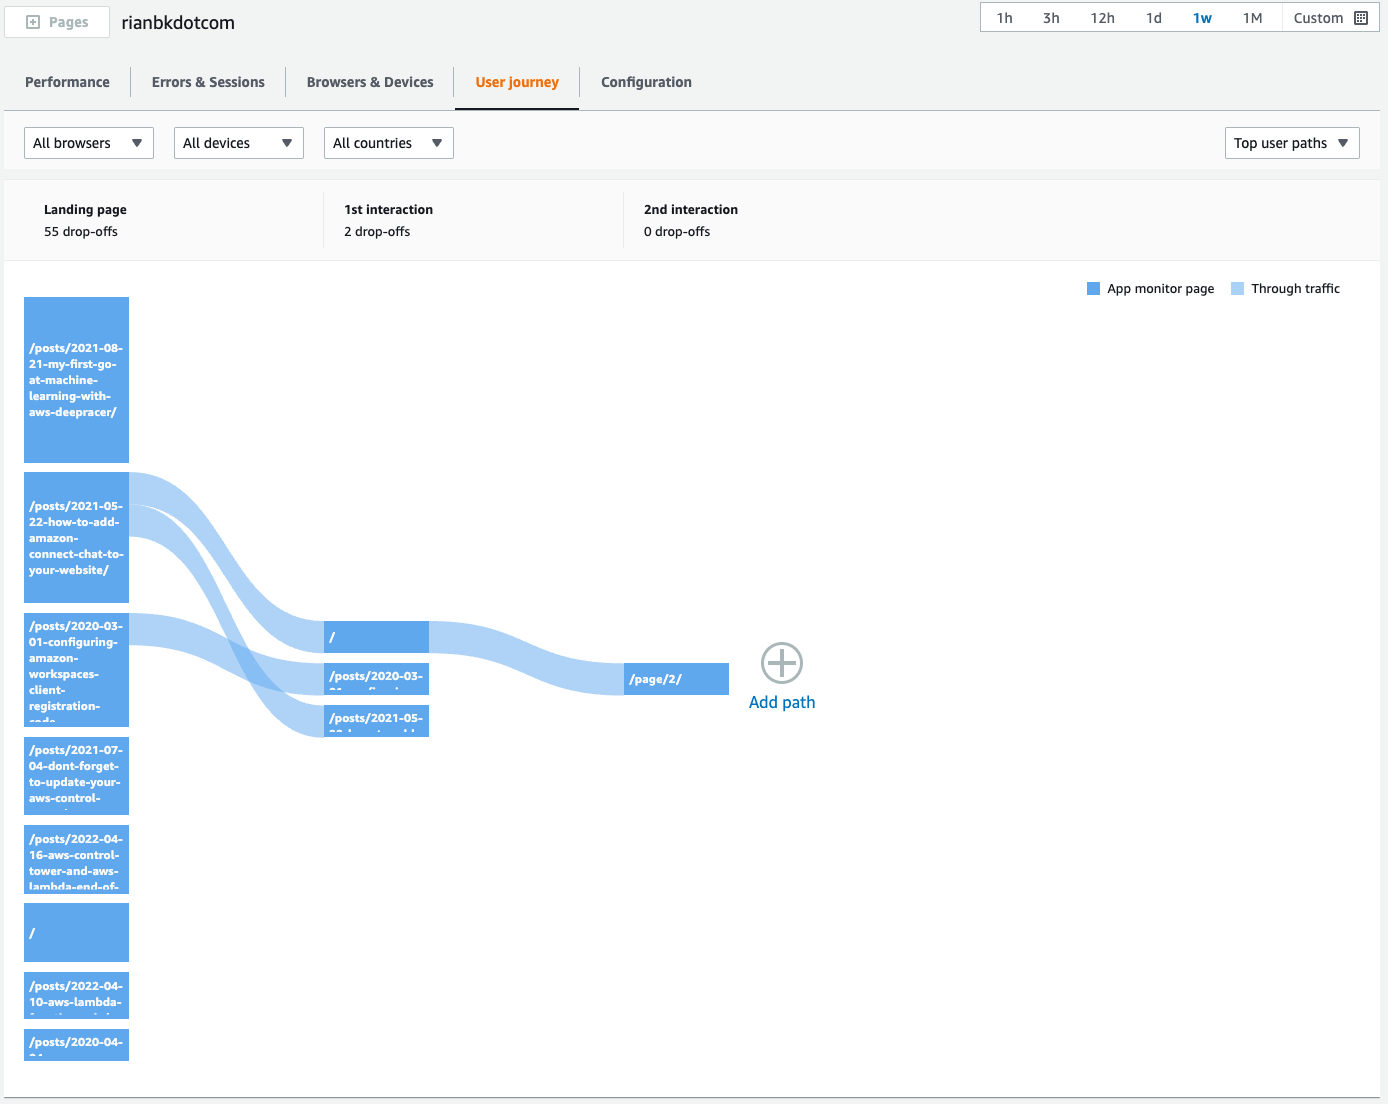
User Journey lets you see where customers enter your application and how they move within it.
Adding CloudWatch RUM to your application
Getting started with RUM is super simple, if your used to adding Google Analytics code to your application, this is exactly the same.
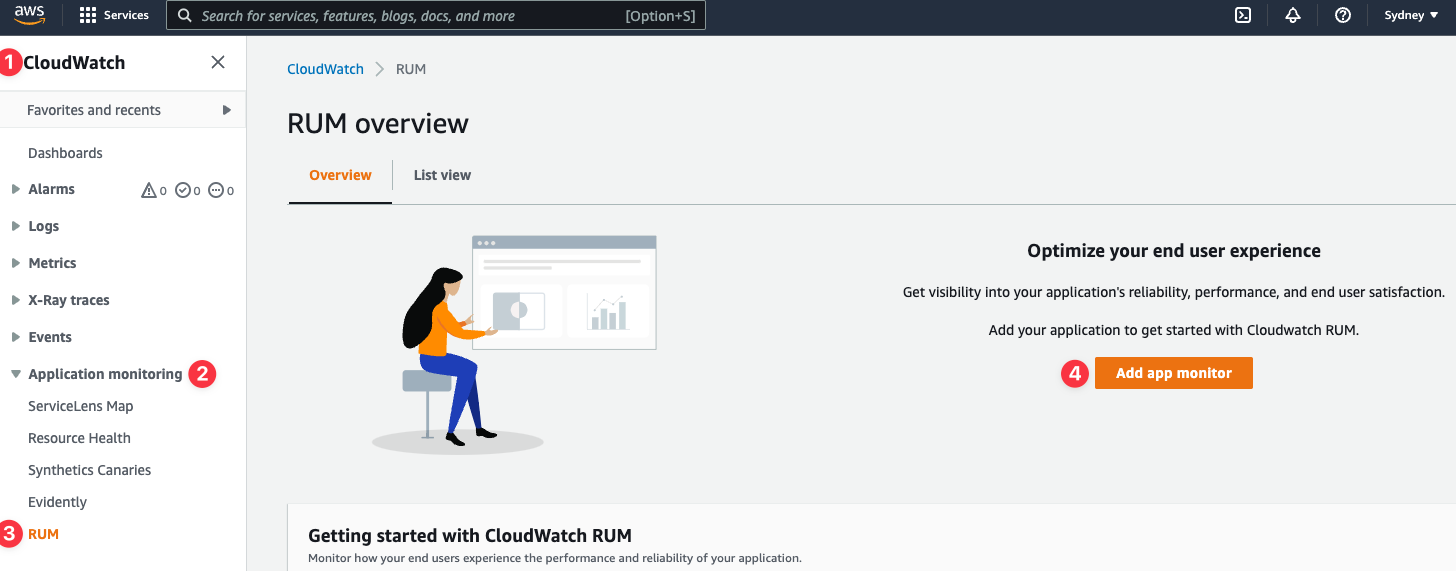
In the AWS Console, Go to CloudWatch, Open up Application monitoring and click RUM. Then click Add app monitor.
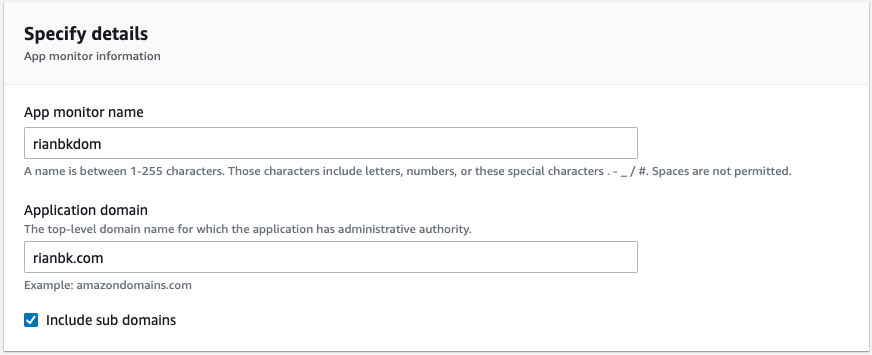
In the add app monitor step, we need to fill out some details about the application. Specify the name for the monitor and application domain.
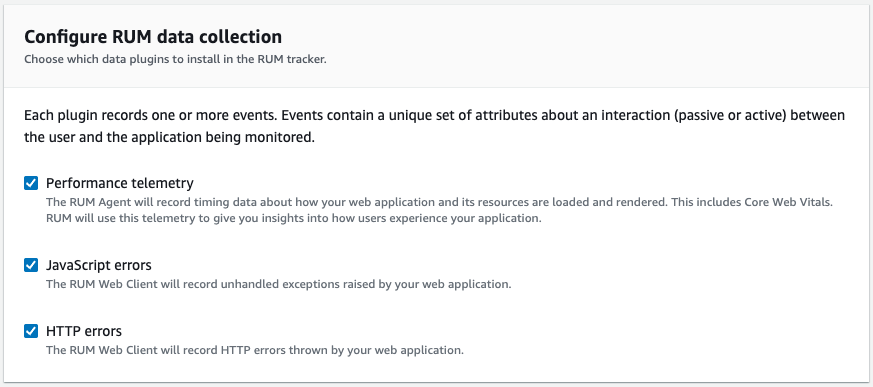
You can select what type of data collection you want to do for your application, this allows you to select what’s important to you.
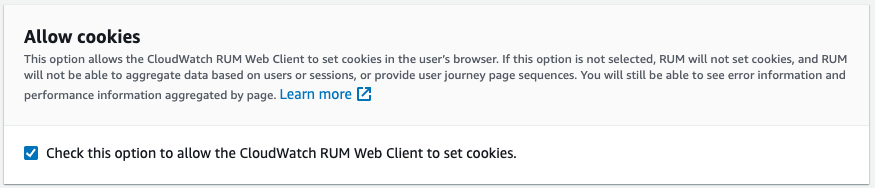
One great feature is being able to enable and disable the use of cookies. I know a lot of people like to avoid these where possible. It does mean you miss out on data aggregation by session and user journeys however if you disable them.
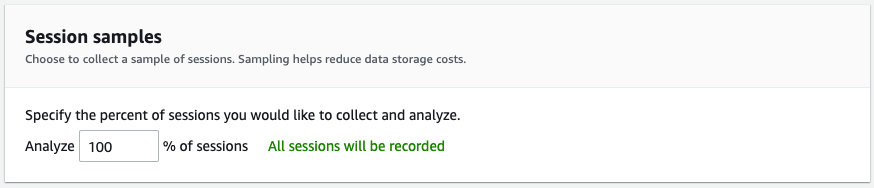
If your web application is a high traffic application, it may not make sense to sample all sessions for your application. Here you can specify your percentage of sessions that are collected and analysed. This can help reduce your storage costs also.
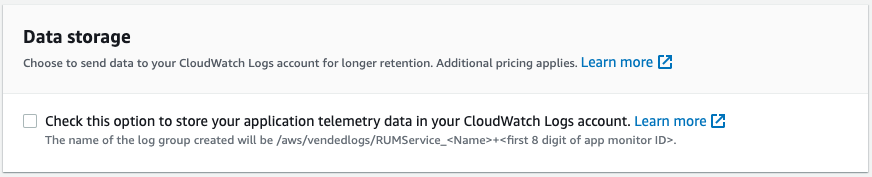
By default, RUM only stores data for the last 30 days, it you want a longer retention you can store your data using CloudWatch Logs.
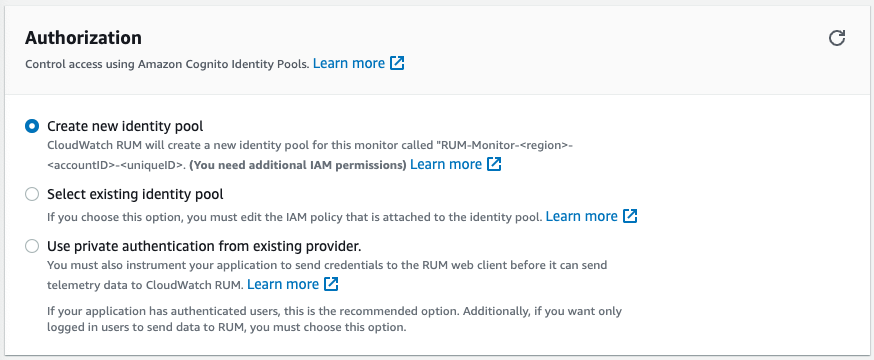
For RUM to work, your app needs to be authorised to send data to AWS. You have three options for this:
- Let RUM create a new Amazon Cognito identity pool (Easiest and the default)
- Use an existing Cognito identity pool you have
- Use your own private authentication (This is the recommended option if your application has authenticated users)
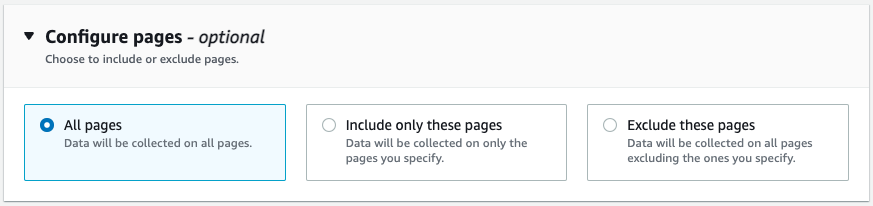
You can also select which pages within your application will be monitored.
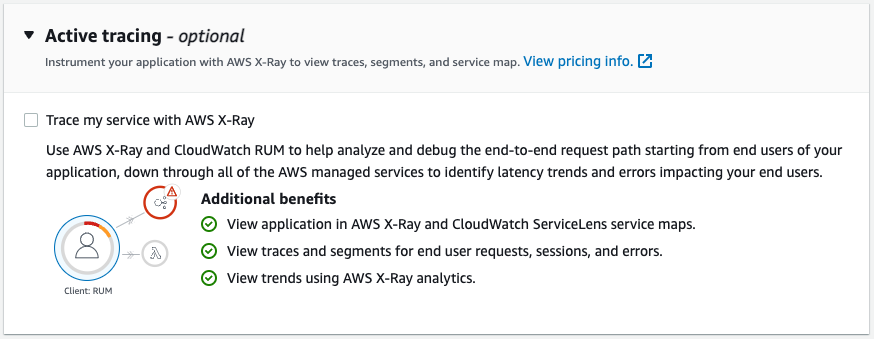
If you’re running a cloud native application in AWS (as I’m sure a lot of you are) you can enhance the monitoring even further with integrating AWS X-Ray and CloudWatch RUM.
Now that we have filled out all the settings, we can click Add app monitor.
Code Snippet
After a few seconds AWS will generate sample code for you to add to your application. AWS provides two ways of adding the code to your application. One as a NPM package and the other as just simple HTML Code.
<script>
  (function(n,i,v,r,s,c,x,z){x=window.AwsRumClient={q:[],n:n,i:i,v:v,r:r,c:c};window[n]=function(c,p){x.q.push({c:c,p:p});};z=document.createElement('script');z.async=true;z.src=s;document.head.insertBefore(z,document.head.getElementsByTagName('script')[0]);})(
    'cwr',
    '1****************************3',
    '1.0.0',
    'ap-southeast-2',
    'https://client.rum.us-east-1.amazonaws.com/1.5.x/cwr.js',
    {
      sessionSampleRate: 1,
      guestRoleArn: "arn:aws:iam::1***********1:role/RUM-Monitor-ap-southeast-2-1***************1-7*************1-Unauth",
      identityPoolId: "ap-southeast-2:1**************************************0",
      endpoint: "https://dataplane.rum.ap-southeast-2.amazonaws.com",
      telemetries: ["performance","errors","http"],
      allowCookies: true,
      enableXRay: false
    }
  );
</script>
It’s that simple, once you’ve deployed your code, access your application and you should start to see telemetry hit the console within a few seconds/minutes.
Some tips
CloudWatch Synthetic Canaries
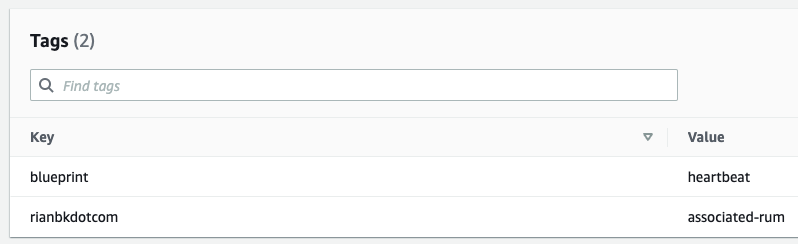
You can integrate your CloudWatch Synthetic Canaries with RUM, just go to your Canaries and add a tag with the Key: App Monitor Name, Value: associated-rum
RUM Web Client
The RUM Web Client is open source and highly configurable. For all the configuration options you can use, have a look here.
CloudWatch Metrics
CloudWatch RUM outputs a bunch of handy metrics to CloudWatch Metrics, which means you can monitor and alert on these. More details on these are here.
Pricing
CloudWatch RUM is currently priced at $1 USD per 100k events.

Comments ()